Insights
See the kind of work VaultData would do for you
A real, working VaultData project below, plus two example dashboards from the industries VaultData works in most — a hotel booking view and a restaurant sales view. As VaultAI and VaultRide develop, insights from those divisions will land here too.
Technical & business case study
Beyond the demos: a full project, start to finish
The dashboards below are simplified previews. This is a complete, working analytics product — audit, methodology, validation, and all — that we designed, built, and deployed.
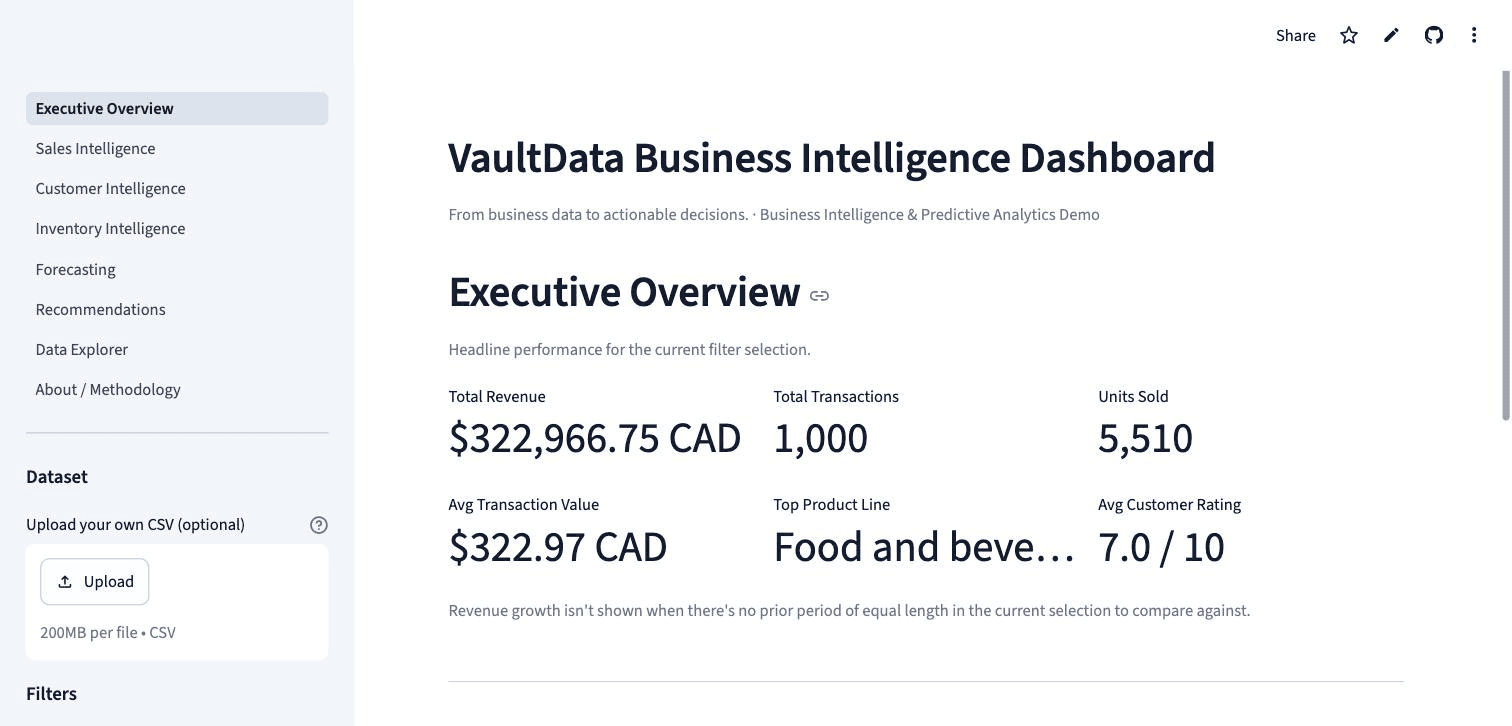
VaultData Business Intelligence Dashboard
From business data to actionable decisions.
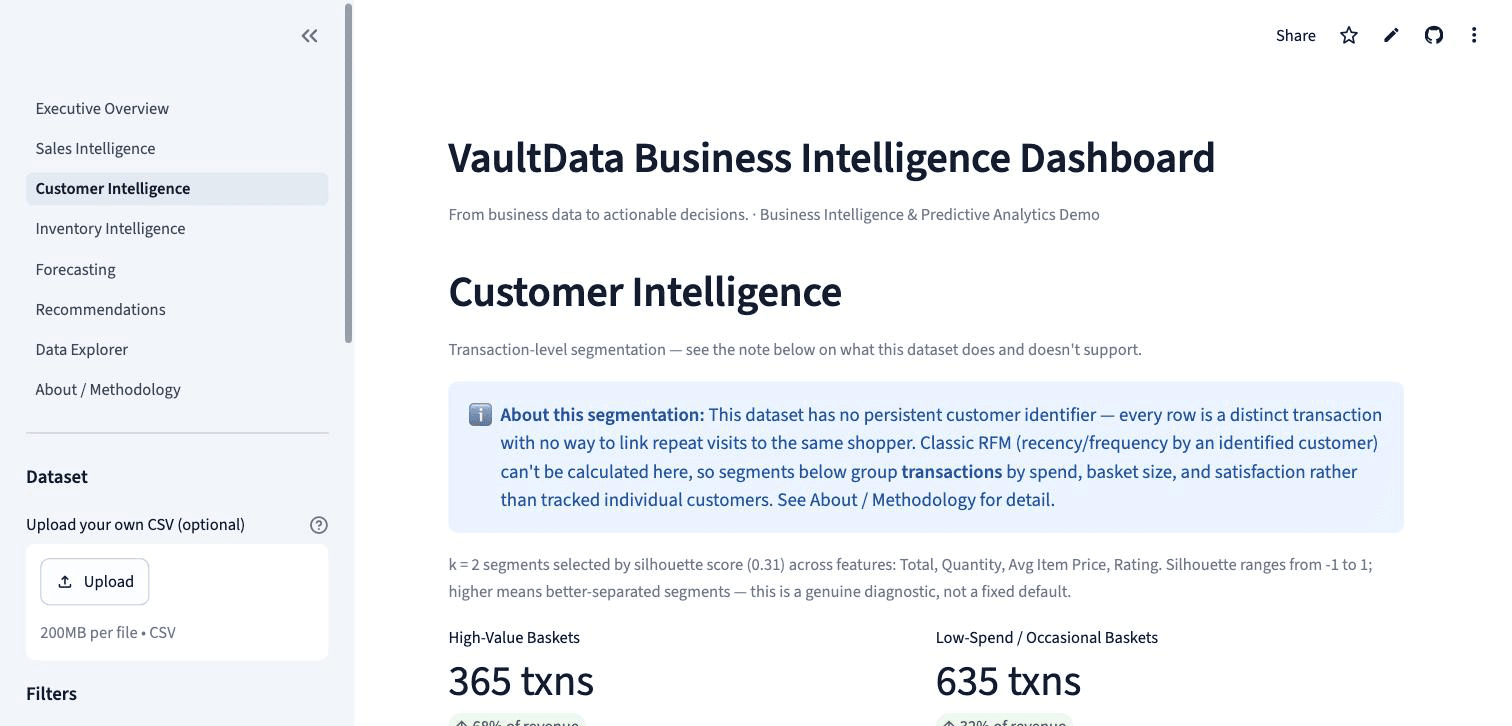
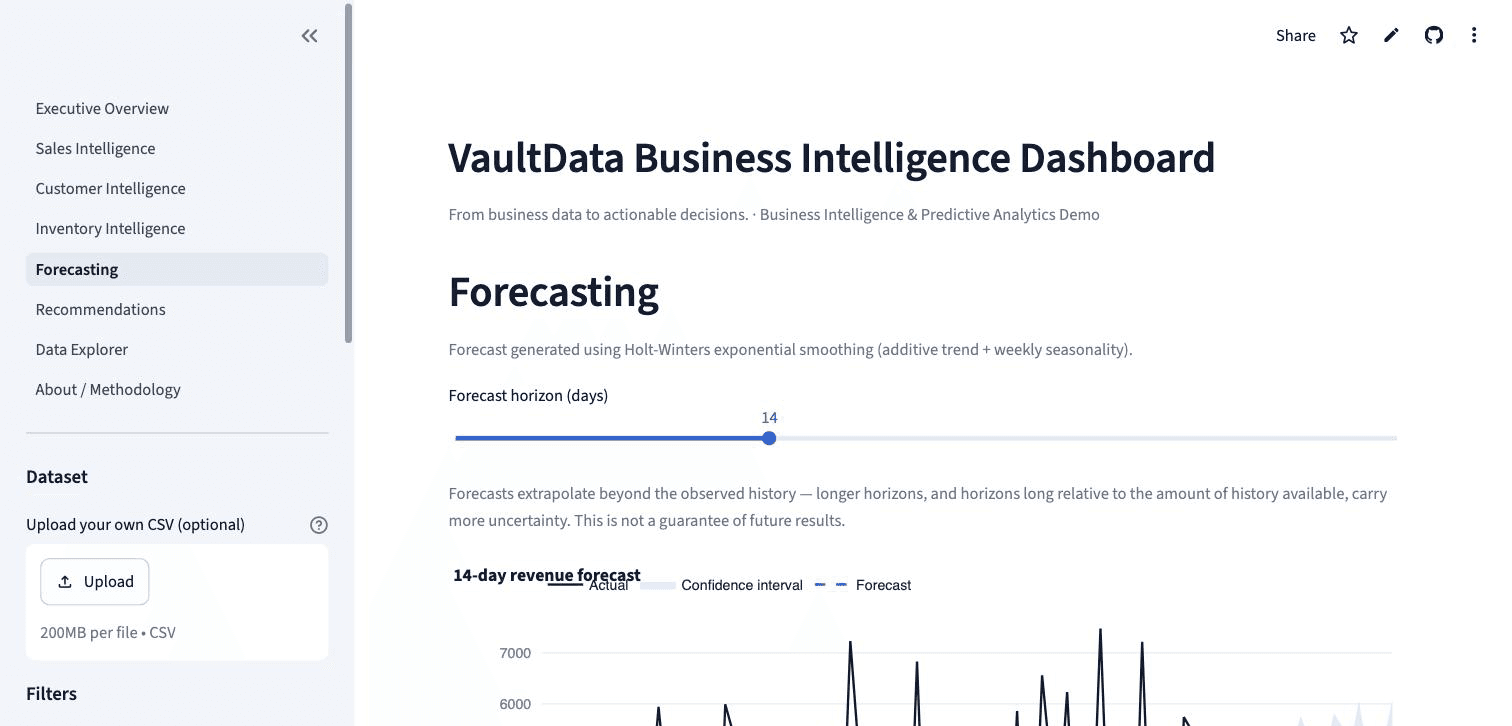
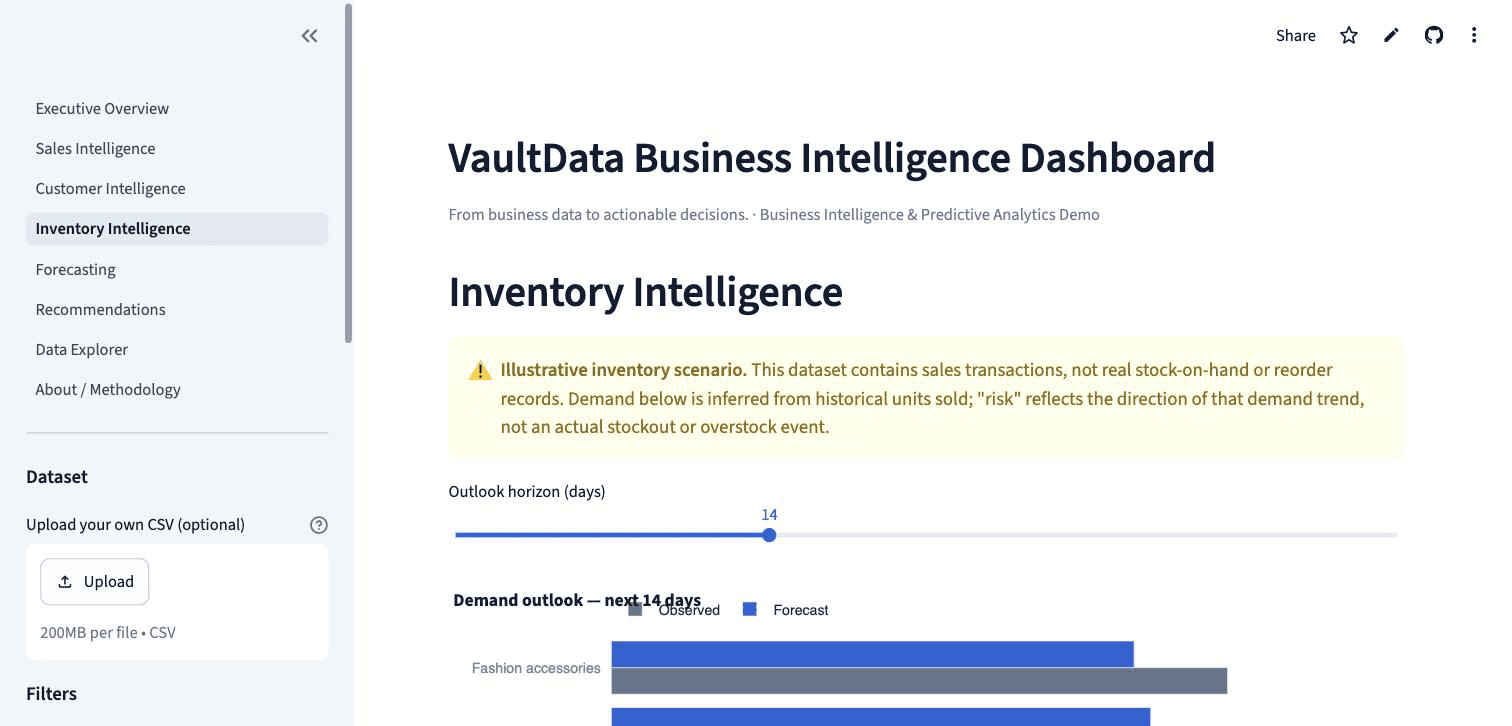
An interactive analytics solution demonstrating how businesses can transform operational data into actionable intelligence through visualization, customer segmentation, forecasting, and predictive analytics.
- Executive KPIs with period-over-period revenue growth
- Transaction-level customer segmentation (k-means, silhouette-validated)
- Holt-Winters revenue forecasting with a time-ordered holdout validation (MAE/RMSE/MAPE)
- Illustrative inventory demand outlook with stockout/overstock risk flags
- Automated data-quality checks and a recommendations engine driven by the live data
Example dashboards
Two simplified previews
Lighter, illustrative examples from other industries VaultData works in — try the filters below.
Hospitality demo
Room bookings by type
Try the filters below — this is a live example of the dashboards we build for clients.
Total bookings
143
vs previous period
+4.2%
Restaurant demo
Sales by meal period
Try the filters below — this is a live example of the dashboards we build for clients.
Day total
$8,980
Coming soon
Articles and guides
We're building out a library of short, practical guides on data, AI, and digital solutions for growing businesses. In the meantime, book a call and we'll answer your questions directly.
Want a dashboard like this for your data?
We'll build a working preview using a sample of your own data — no commitment required.